Every quant has been there. You’re backtesting a strategy, the overall results look good, but something feels off when you dig into the day-by-day breakdown. You keep digging while your gut says “this feels like data mining,” but the statistics keep pointing to the same uncomfortable truth – some trading days are just bad for business.
That’s where I found myself with the SPX opening range breakout strategy I recently shared. As a quick refresher: the strategy sells credit spreads in the direction of 60-minute opening range breakouts, positioning the short strike to profit from the range boundaries acting as support / resistance. While most days were profitable, two days were a clear drag on performance, both showing negative average returns and a propensity for catastrophic losses.
Refresher: The strategy capitalizes on SPX microstructure shifts enabled by May 2022 CBOE changes. It sells 0DTE credit spreads in the direction of 60-minute opening range breakouts, positioning the short strike to profit from the range boundaries acting as support / resistance.
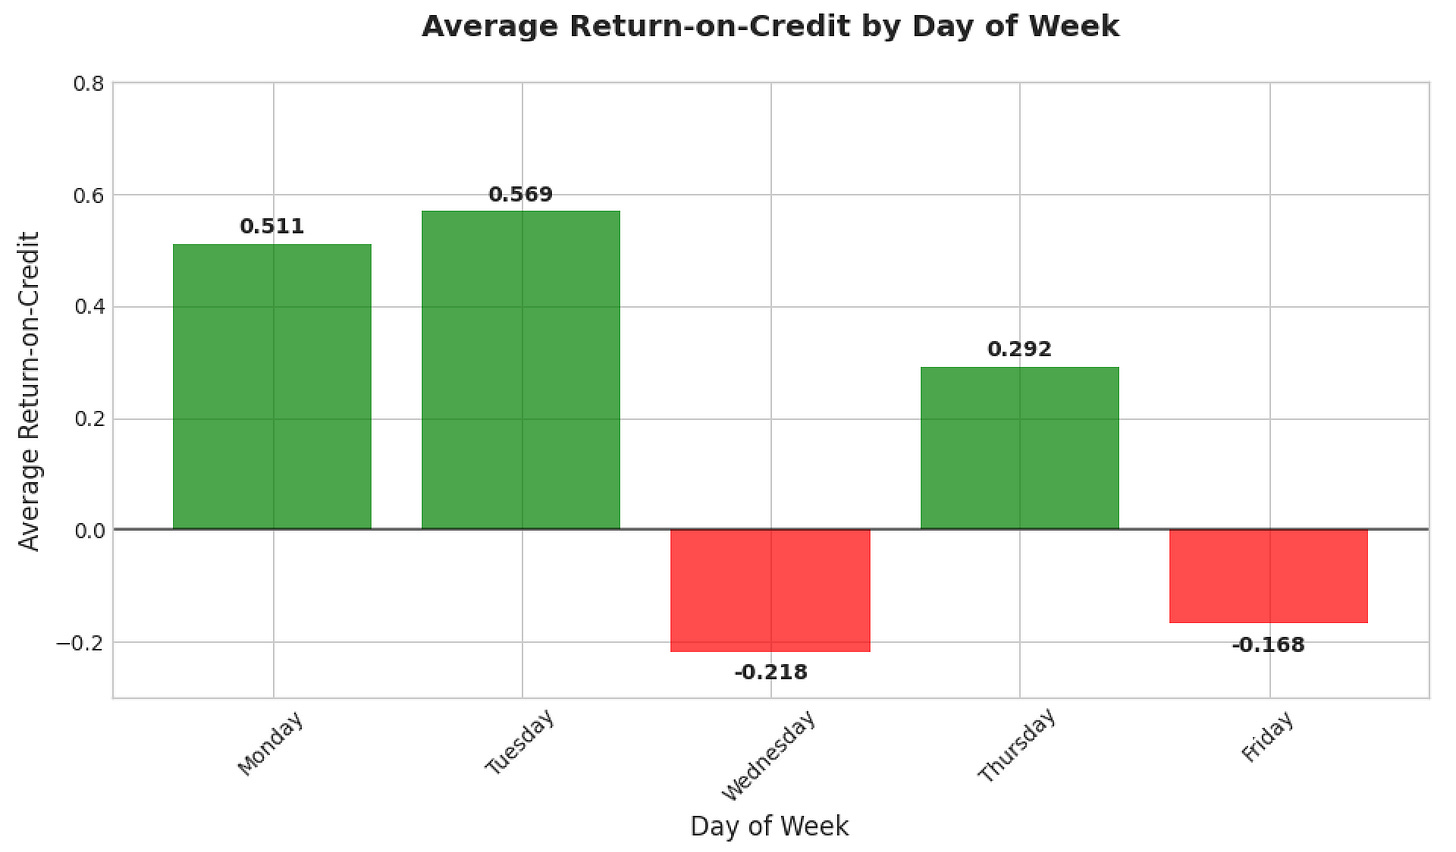
The below illustrates the underperforming days when running the strategy with fixed position size per trade. I’m using Return-on-Credit instead of raw P&L (dollar returns) to normalize losses against the premium collected on each trade. This accounts for market drift over time, creating a more stationary metric that accurately measures the underperformance we are seeing.
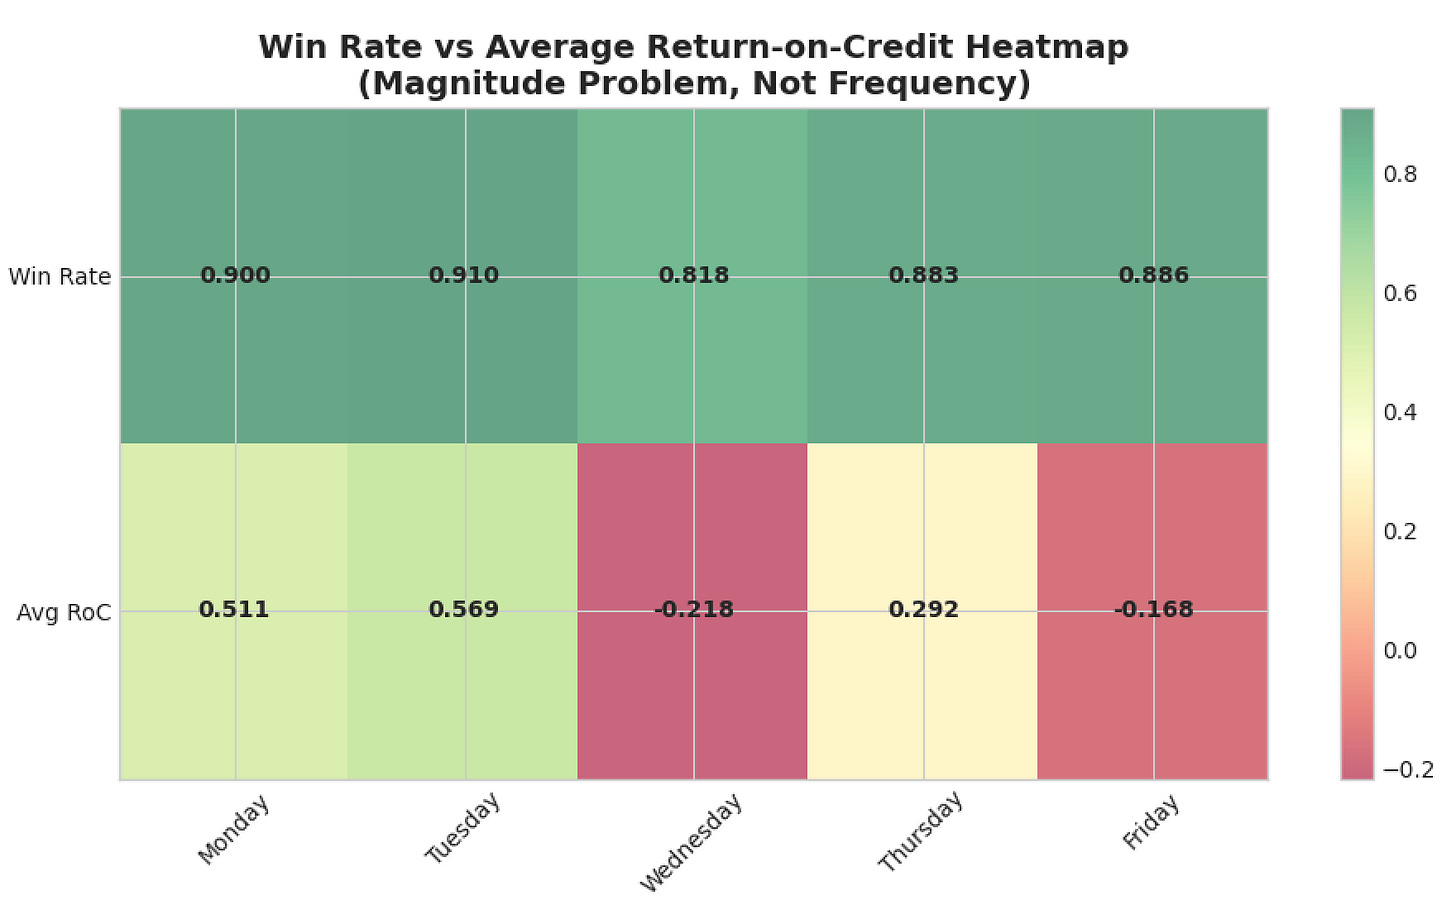
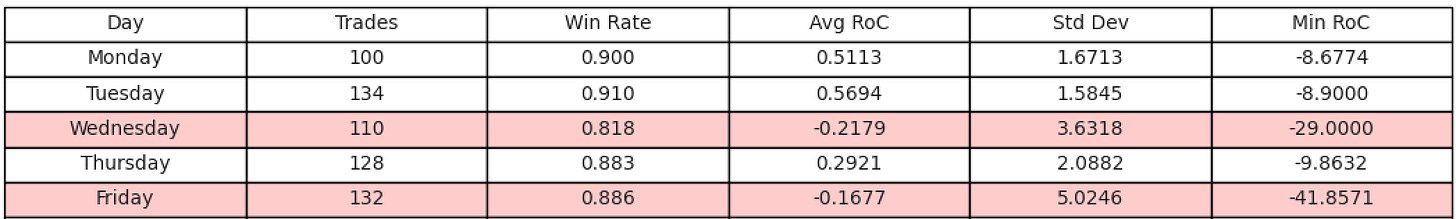
This heatmap below visualizes the core problem. The top row (Win Rate) is consistently green, showing a high probability of success across every week day. The bottom row (Avg Return-on-Credit or RoC) however, reveals the underlying issue: the deep red on Wednesday and Friday shows that the magnitude of the average loss on those days is severe enough to wipe out all the small gains.
The data posed the question: Was this a real, exploitable pattern or a false signal?
Validating the Anomaly
To confirm this was a structural effect and not just statistical noise, I put the underperformance through some independent tests, based on trading a fixed position size of 10 contracts, from May 2022 (introduction of daily 0DTEs) to present. I started with chi-square tests on win rates and t-tests on magnitude:
- ❌ Fail: Chi-Square Test (p = 0.229)
- This test, which checks if win rates differ by chance, showed no statistical significance.
- ✅ Pass: T-Test for Return-on-Credit (p = 0.013)
- This test, comparing the magnitude of P&L, was highly significant.
Insight: the problem isn’t how often we lose, but how badly we lose.
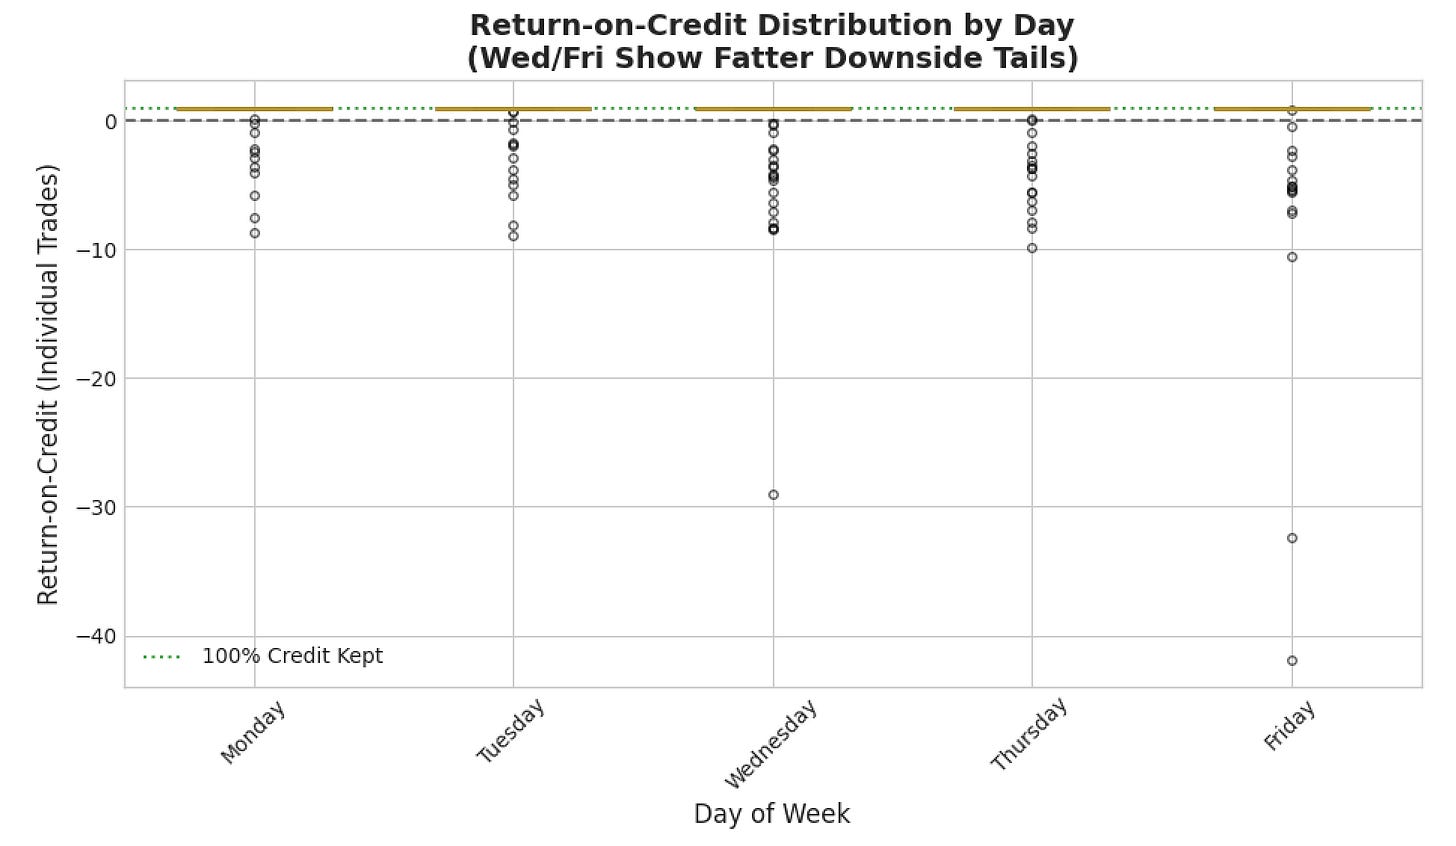
Visualizing the “Fat Tail” Risk
I went on to plot a simple distribution plot of every trade’s outcome, and the risk became even more apparent. While most losses on other days are contained, Wednesday and Friday feature extreme negative outliers. Friday, in particular, has a single loss greater than -40x the credit received. This is the “fat-tailed” risk that kills a portfolio.
Persistent Over Time, Unstable Across Regimes
An effect that doesn’t persist is likely just noise. I plotted rolling 60-day average returns for each day and confirmed this underperformance is not a one-time event.
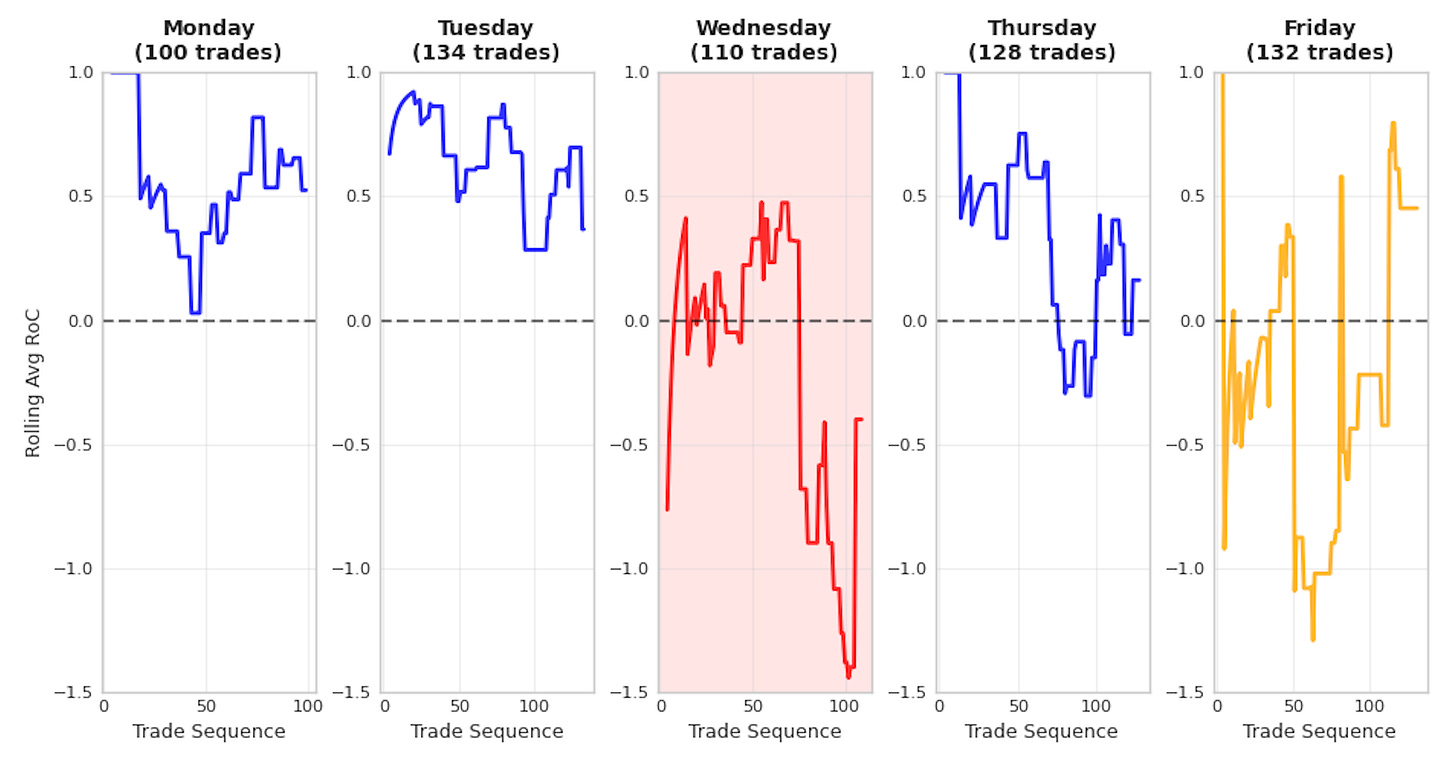
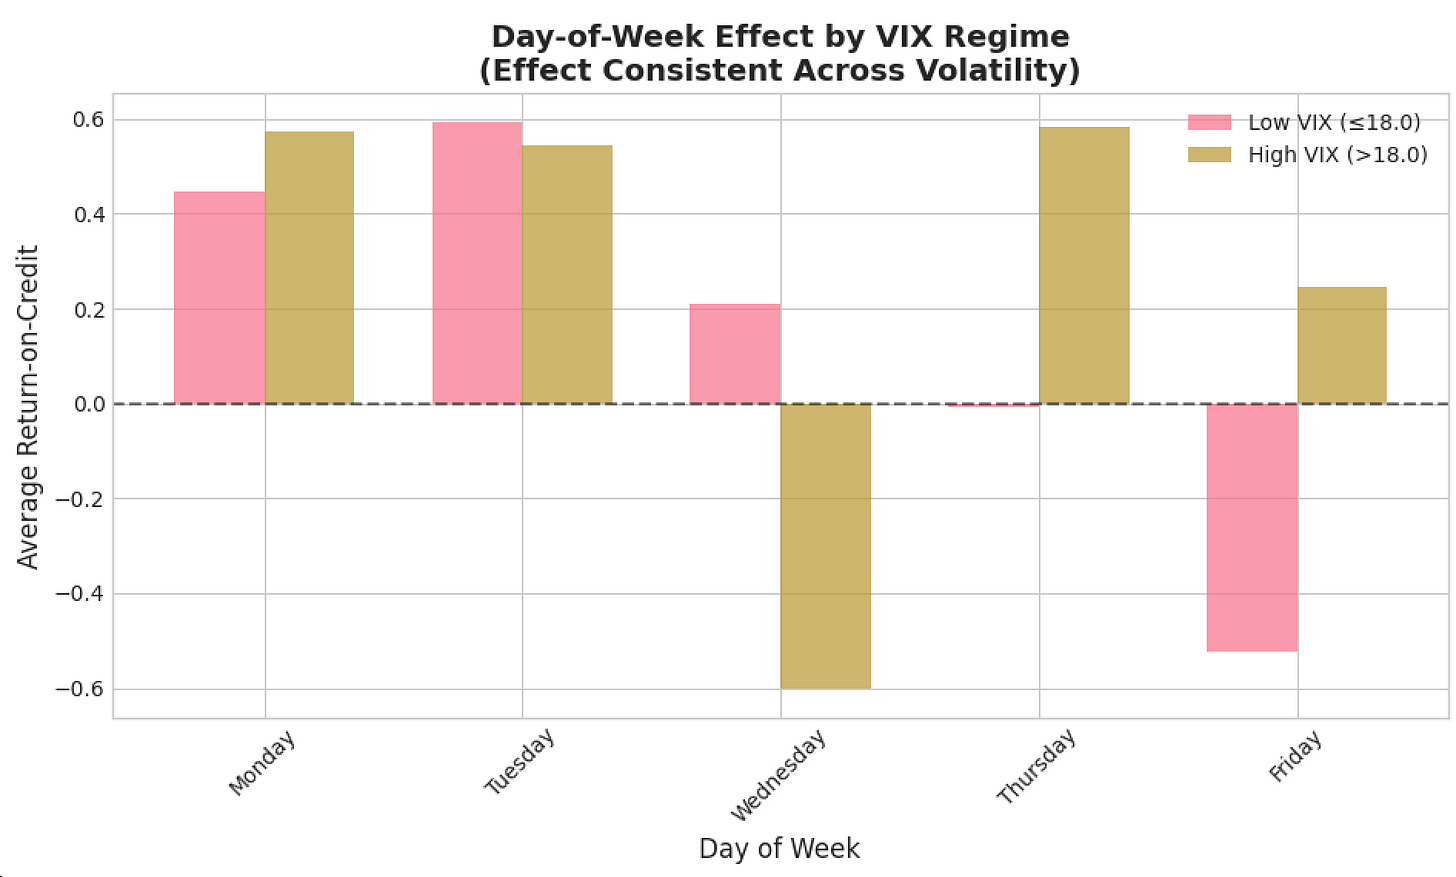
Furthermore, the actual performance on these days is highly unstable, with the outcome flipping entirely based on the volatility regime. As the chart below shows, Wednesday’s performance collapses in high VIX, while Friday’s severe underperformance occurs in low VIX. This regime-based instability is a sign of a structural flaw, making both days unreliable.
Confirming the Volatility Pattern
The standard deviation of returns seems to tell the final story. The risk profile on Wednesdays and Fridays is completely different from other days. Friday’s standard deviation (5.02) is nearly 3x higher than Tuesday’s (1.58). The measurement further confirmed these days operate under fundamentally different risk parameters.
But… Why Wednesday and Friday?
It turns out that this pattern isn’t random; it’s rooted in the market’s weekly schedule. Both days have become hubs for activity that undermines simple technical signals.
Friday is the traditional Weekly Options Expiration (OPEX), where massive gamma hedging by dealers can accelerate trends or cause violent reversals. Wednesday has become a “mini-Friday” with its own significant options expiration, but it also carries another risk: it’s a focal point for scheduled economic data.
Research published in the Review of Economic Studies confirms that public news announcements create abnormal spikes in volume and volatility that distort intraday price action (Bollerslev et al., 2018). This is driven by recurring, institutional-grade data drops, like the EIA Petroleum and MBA Mortgage reports, both released on Wednesday mornings, for example. This combination of OPEX hedging and news-driven volatility likely makes these days structurally different and fundamentally riskier for an opening range breakout strategy.
The Verdict
The evidence – significant P&L underperformance, visible fat-tailed losses, consistency across time and volatility regimes, and supporting market-microstructure research – points to a structural market phenomenon.
Excluding these days isn’t overfitting. It’s pricing in the well-documented microstructural risk of a mid-week and end-of-week options market.
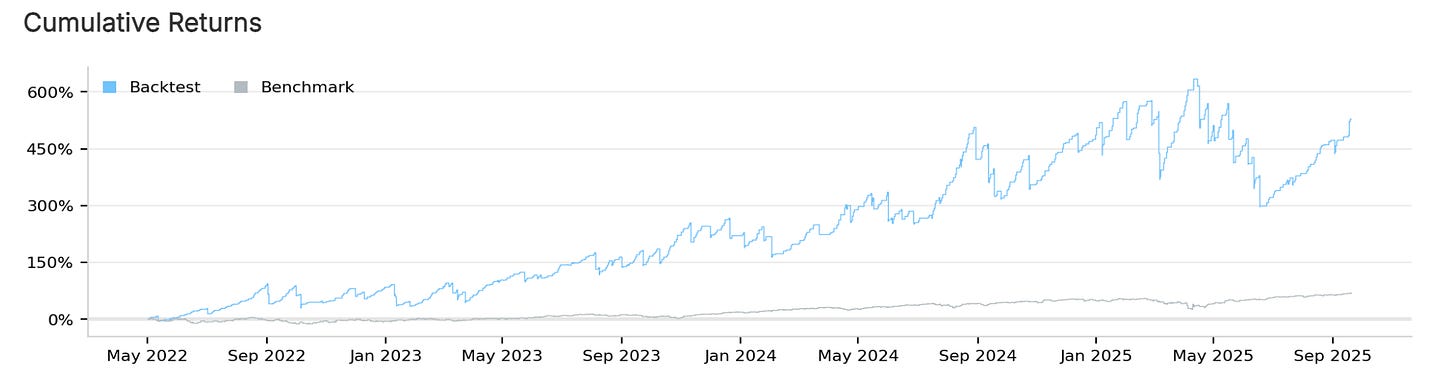
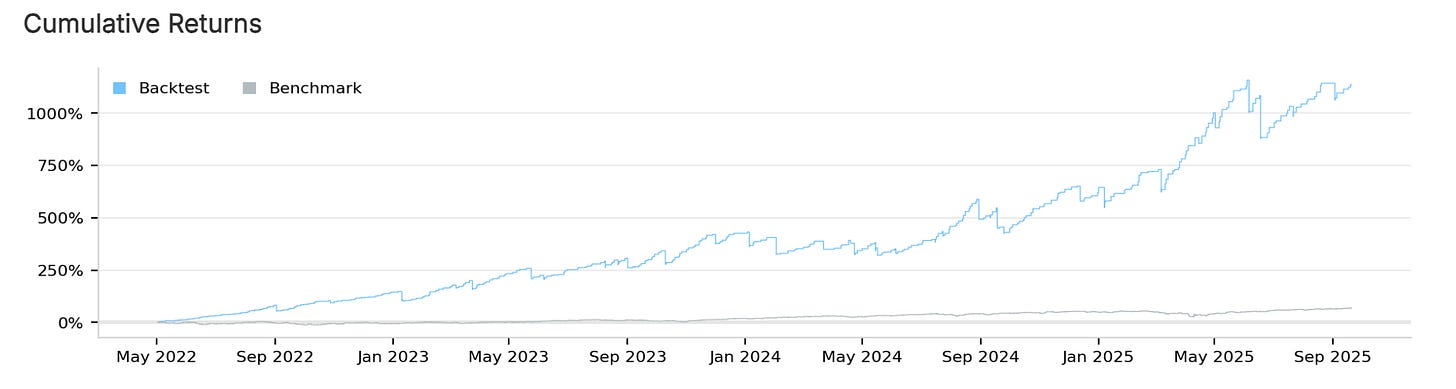
Excluding these days results in a strategy that is both radically more profitable and safer: in the example below it more than doubles the net profit while cutting the maximum drawdown in half, leading to a full 1.0 point improvement in the Sharpe Ratio.
Here we can see the before and after returns, risking 20% of a $10k account per trade. Again, trading from May 2022, when the CBOE introduced daily SPX expirations.
Trading every day of the week:
- Trades: 603
- Sharpe: 1.254
- Drawdown: 46.0 %
- Net Profit: 528%
- Return-to-Drawdown ratio: 11.4x
Trading with Wednesday and Friday excluded:
- Trades: 363
- Sharpe: 2.258
- Drawdown: 23.7 %
- Net Profit: 1135.2%
- Return-to-Drawdown ratio: 47.89x
Excluding Wednesday and Friday, we give up 40% of the trades to more than double the profit, halve the drawdown, and add 100 basis points to the Sharpe ratio.
Key Takeaway
These numbers aren’t the result of a lucky guess; they are the direct outcome of a disciplined process. It started with a simple observation – a hunch that something was off – and led to a multi-faceted statistical validation.
When your experience gives you a hunch, don’t ignore it, but don’t blindly trust it either. Do the work. Test it, stress-test it across different time periods, check for stability across market regimes, and be brutally honest about what the data tells you.
The evidence here led to a disciplined and highly profitable decision. Because true alpha isn’t found in trading more often, but in having the discipline to prove, through data, precisely when not to.
Updated Code
- Interactive Backtest (May 2022 – Sept 2025)
- Click ‘code’ to browse / copy the Python code (main.py)
- Click ‘clone’ to backtest it yourself in Quantconnect
- Note: Some QuantConnect stats dont account for multi-leg options positions properly, so in the interactive report you may see some numbers off, like win rate.
I’m considering exploring filters based on Gamma Exposure to improve the remaining Monday/Tuesday/Thursday trades. If there’s interest in this, let me know in the comments!
Edit:
After posting this, I realized a nuance worth clarifying:
Failed spreads that are held to expiration always take on the maximum possible loss, so our extreme Wed/Fri losses are extreme maximum losses, indicating that the pricing dynamics on those days make the Risk-Reward profile of our spreads heavily skewed to the downside.
Given this insight some might ask: rather than complete avoidance, could these days be traded profitably with modified parameters like differen spread widths or different anchor strike selection? Possibly.
In my opinion, however, the exclusion approach is a more straightforward path to boosting risk-adjusted returns, and is less prone to overfitting.
[…] Refining The 0DTE SPX Breakout Strategy with Evidence-Based Exclusions [Quantish] […]